Alderson Broaddus University Student Achievement Data (Undergraduate) – this link will take you to the National Center for Education Statistic’s website. NCES is the primary federal entity for collecting and analyzing data related to education.
Summary of Employment and Graduate School Information for Graduates Receiving an Associate or Bachelor’s Degree
| 2021 | |
|---|---|
| EIF (Employed In Field) | 57% |
| EOF (Employed Out of Field) | 17% |
| Continuing Education | 26% |
| Unemployed | 0% |
| Total Survey Response Rate | 84% |
Student Achievement Data for Physician Assistant Studies Program
| Entering Year/Graduation Year | # Entered | Male | Female | Decelerated/Attrition | Graduates |
|---|---|---|---|---|---|
| Entered: 2005-2006 Graduated: 2008 | 54 | 12 | 42 | 9 Decelerated - 6 Attrition - 3 | 43 80% |
| Entered: 2006-2007 Graduated: 2009 | 50 | 14 | 36 | 10 Decelerated - 10 Attrition - 0 | 45 90% |
| Entered: 2007-2008 Graduated: 2010 | 50 | 15 | 35 | 6 Decelerated - 4 Attrition - 2 | 46 92% |
| Entered: 2008-2009 Graduated: 2011 | 48 | 12 | 36 | 10 Decelerated - 7 Attrition - 3 | 38 79% |
| Entered: 2009-2010 Graduated: 2012 | 38 | 12 | 26 | 2 Decelerated - 2 Attrition - 0 | 36 95% |
| Entered: 2011 Graduated: 2013 | 14 | 6 | 8 | 2 Decelerated - 1 Attrition - 1 | 12 86% |
| Entered: 2012 Graduated: 2014 | 30 | 12 | 18 | 2 Decelerated - 0 Attrition - 2 | 29 97% |
| Entered: 2013 Graduate: 2015 | 36 | 10 | 26 | 2 Decelerated - 0 Attrition - 2 | 34 94% |
| Entered: 2014 Graduate: 2016 | 36 | 15 | 21 | 4 Deceleration - 0 Attrition - 4 | 32 88% |
| Entered: 2015 Graduate: 2017 | 36 | 18 | 18 | 0 Deceleration - 0 Attritions - 0 | 36 100% |
| Entered: 2016 Graduate: 2018 | 36 | 7 | 29 | 2 Deceleration - 1* Attritions - 2 | 34 100% |
| Entered: 2017 Projected Graduate: 2019 | 35 | 8 | 27 | 6 Deceleration - 0 Attritions - 6 | ----- |
| Entered: 2018 Projected Graduate: 2020 | 36 | 14 | 21 | 2 Deceleration - 0 Attritions - 2 | 34 94% |
| Entered: 2019 Projected Graduate: 2021 | 36 | 13 | 23 | 3 Deceleration - 0 Attritions - 3 | 33 92% |
| Entered: 2020 Projected Graduate: 2022 | 36 | 11 | 25 | 11 Deceleration - 1 Attritions - 10 | 26 72% |
| Entered: 2021 Projected Graduate: 2023 | 26 | 4 | 22 | 6 Deceleration - 1 Attritions - 5 | ----- |
| Entered: 2022 Projected Graduate: 2024 | 25 | 8 | 17 | 4 Deceleration - 0 Attritions - 4 | ----- |
*December 2018 Graduate
Summary Report Graduate Performance on Certification Exam 2014-2018
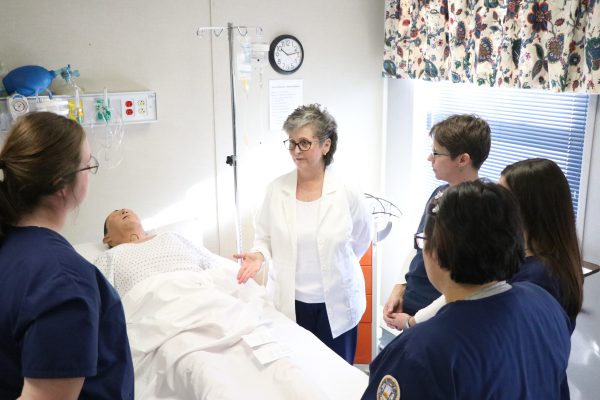
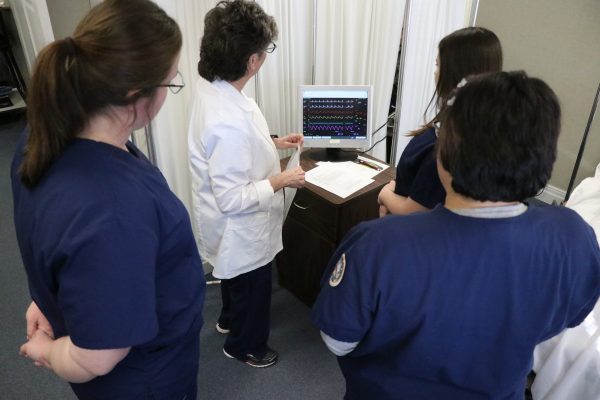
Student Achievement Data for Nursing Program
AB 2020 NCLEX Results
| BSN Graduates | National Mean | Traditional | LPN-BSN | All AB Graduates |
|---|---|---|---|---|
| Class of 2018 | 91.6% | 76.9% | 100% | 83.3% |
| First Time Exam Takers | N=79,235 | N=13 (N=14 originally: 1 student did not complete requirements to test) | N=5 | N=18 |
| 1st Attempt Pass | N/A | 10/13 | 5/5 | 15/18 |
| Class of 2019 | 91.8% | 68.4% | 88.9% | 75% |
| First Time Exam Takers | N= 76,496 | N=19 (N=20 originally: Student from 2018 eligible to test, 2 did not test) | N=9 | N=28 |
| 1st Attempt Pass | N/A | 13/19 | 8/9 | 21/28 |
| Class of 2020 | 91% | 76.5% | 100% | 83.3% |
| First Time Exam Takers | N=79,320 | N=17 (1 student did not test in 2020) | N=7 | N=24 |
| 1st Attempt Pass | N/A | 13/17 | 7/7 | 20/24 |
| Class of 2021 | 91% | 76.5% | 100% | 83.3% |
| First Time Exam Takers | N=79,320 | N=17 (1 student did not test in 2020) | N=7 | N=24 |
| 1st Attempt Pass | N/A | 13/17 | 7/7 | 20/24 |
| Class of 2022 | 91% | 76.5% | 100% | 83.3% |
| First Time Exam Takers | N=79,320 | N=17 (1 student did not test in 2020) | N=7 | N=24 |
| 1st Attempt Pass | N/A | 13/17 | 7/7 | 20/24 |
| 3 Year Avg 2018-2020. | N | 49 | 21 | 70 |
| Pass | 36 | 20 | 56 | |
| Pass Rate | 73.5% | 95.2% | 80% | |
AB SON Post Graduation Employment Rates Traditional and LPN-BSN
| Class | N | RN Job | % RN Job | Grad School | % Grad School | *Traditional | *LPN-BSN | *RN-BSN | Survey Response Rate |
|---|---|---|---|---|---|---|---|---|---|
| 2022 | |||||||||
| 2021 | |||||||||
| 2020 | |||||||||
| 2019 | 32 | 31 | 100% | 0 | 0% | 21 | 9 | 2 | 31/32 = 97% |
| 2018 | 18 | 18 | 100% | 0 | 0% | 14 | 5 | 2 | 18/21=86% |
| 2017 | 35 | 32 | 100% | 0 | 0% | 26 | 8 | 1 | 32/35 = 91% |
| 2016 | 22 | 21 | 96% | 1 | 4% | 14 | 8 | 7 | 26/29 = 90% |
| 2015 | 29 | 29 | 100% | 0 | 0% | 16/15/15 | 13/13/13 | 3/0/NA | 28/32 = 87.5% |
| 2014 | 31 | 31 | 100% | ||||||
| Responses Received from Annual Survey Conducted by Career Advancement Office: Sent out 6-9 Months post-graduation starting in 2016 | |||||||||
| *Degrees Conferred/Survey Responses/Employed in Field | |||||||||
AB SON Time to Complete Program
| Class of | Program | 100% | 150% | 150% + |
|---|---|---|---|---|
| 2017 | Trad | 19 | 7 | 0 |
| LPN | 8 | 0 | 0 | |
| 2018 | Trad | 10 | 3 | 1* |
| LPN | 4 | 1 | 0 | |
| 2019 | Trad | 14 | 4 | 1* |
| LPN | 7 | 2 | 0 | |
| 2020 | Trad | 17 | 1 | 0 |
| LPN | 7 | 0 | 0 |
AB SON Yearly PROGRAM COMPLETION RATES for Traditional and LPN-BSN Nursing Students
| YEAR | Program | Started | Finished | Completion Rate | Attrition Rate |
|---|---|---|---|---|---|
| 2017 | Trad | 31 | 26 | 84% | 16% |
| LPN | 18 | 8 | 44% | 56% | |
| Overall | 49 | 34 | 69% | 31% | |
| 2018 | Trad | 17 | 14 | 82% | 18% |
| LPN | 8 | 5 | 63% | 37% | |
| Overall | 25 | 19 | 76% | 24% | |
| 2019 | Trad | 22 | 19 | 86% | 14% |
| LPN | 12 | 9 | 75% | 25% | |
| Overall | 34 | 28 | 82% | 18% | |
| 2020 | Trad | 22 | 16 | 73% | 27% |
| LPN | 20 | 7 | 35% | 65% | |
| Overall | 42 | 23 | 55% | 45% |
AB SON Completion Rates for RN-BSN Cohorts
| Year/ Cohort # | Enrolled (N) | Completed Program |
|---|---|---|
| 2020-2021 | 9 | |
| 2019-2020 | 10 | None |
| 2018-2019 | 4 | 3 (75%) |
| 2017-2018 | 7 | 4 (57%) |
| 2016-2017 | 8 | 7 (88%) |
| 5 | 6 | 5 (83%) |
| 4 | 4 | 4 (100%) |
| 3 | 7 | 4 (57%) |
| 2 | 5 | 2 (40%) |
| 1 | 6 | 4 (67%) |